Subpage of Tools menu
Table Of Contents
The dialog
Setting up the analysis
The controls
While tuning
After tuning
Statistics
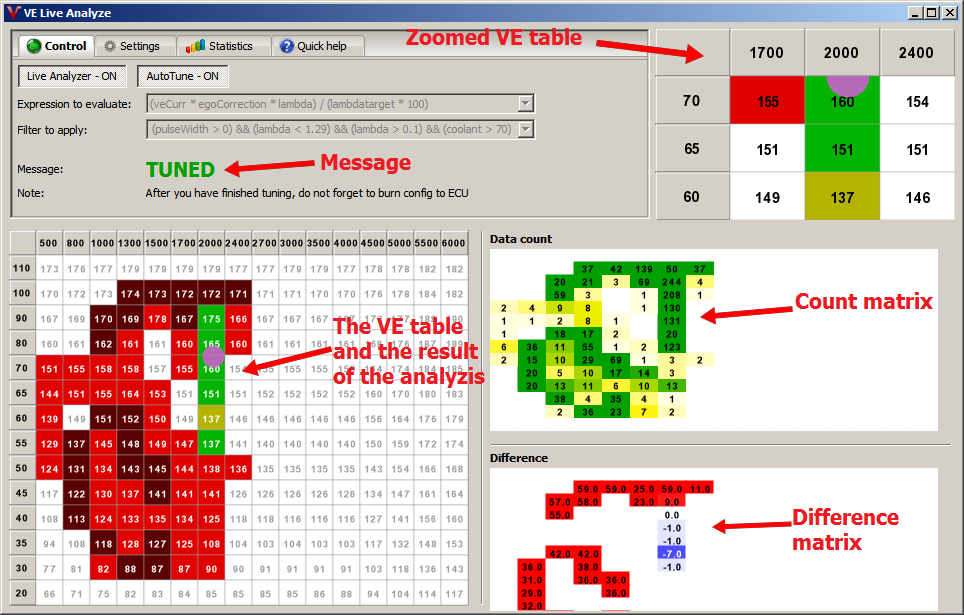
Live VE Analyzer, first look on the dialog
See description here
First click on the ![]() Settings tab to check settings.
Settings tab to check settings.
If you want to limit the analysis to a rectangular area, set Minimum and Maximum RPM and MAP/TPS values. If you want to do the analysis on the whole VE table, left them empty.
You can also set the RPM and the MAP/TPS tolerance. The less tolerance means that the difference between the incoming value and the center value should be small. E.g. if RPM tolerance is 0% and the cell center is 1500, then the incoming RPM value must be exactly 1500. If RPM cell centers are eg. 1300, 1500, 1700 and RPM tolerance is 100%, then in cell with center value 1500, all values between 1400 and 1600 are considered. If tolerance is only 50%, then RPM must be between 1450 and 1550 or it will be an outlier.
Min. data: minimum count of data needed in a cell to perform tuning.
Tuning precision: in continuous tuning, the calculated values may vary. If the difference between the consecutive values is smaller then the precision, the cell will be marked as TUNED (background of the cell will be green). Difference means actually the ratio of those values.
You can set the maximum allowed change in the VE table in positive and negative direction. Note: this is an absolute value, valid for each cell.
Let's see an example: you set 8 and 4 for maximum allowed change. (8 in positive, 4 in negative direction). If in the VE cell the original value is 106, then the VE table will be tuned only if the calculated value for this cell is between 102 and 114.
If you want to use the Tune Ahead feature, you can enable it by turn on the checkboxes. At the moment only vertical ("Up") and horizontal ("Right") tuning-ahead is supported.
Turn on the tune-ahead checkboxes to enable the Tune-Ahead feature (see below).
If you find the settings correct, click on the ![]() Control Panel tab.
Control Panel tab.
The controls
Below the control area you can see the 'tuned' VE table. Initially it is intact, the values are the same as in the VE table, and the background of the cells is white. The meaning of the white color is that there were no incoming data in the cell.
During the tuning process the background color and the value of the cell will be changed (see below).
The current RPM and MAP/TPS values are marked by a colored circle, this cell and its 3x3 neighbourhood is displayed in the right-upper corner of the dialog (Zoomed VE table).
On the right side of the tuned VE table you can see two tables:
- the upper table is a counter table. You can see how many valid values are stored in a cell. If there were no incoming data in the cell, the background of the cell is white. Otherwise the count of the incoming data will be displayed in the cell and the background color will be yellow. When this count reaches the minimal value (see Settings), the background becomes green and the value of this cell in the VE table will be modified according to the statistical analysis.
- the lower table shows the difference between the original VE and the calculated VE (red color means positive, blue color means negative difference)
Edit filter if you want but in most cases you should not change it. The expression is fixed, you can not alter it.
Click on the Live analyzer button to start collecting data.
If you want to let the analyzer change the VE table automatically, switch on the AutoTune function.
While tuning
The analyzer will collect data and evaluate the expression and the filter. If it passed the filter(s) (including limiting RPM/MAP/TPS values, tolerance etc), the analyzer will do some
statistical calculation. During this process the count table and the tuned VE table will be updated.If the count of data reaches the minimal limit in a cell, the difference table will be updated too.
In the control panel the analyzer will show messages:
- Filter failed - filter failed
- Collecting data - the analyzer needs more incoming data
- TUNED - cell is tuned
- Too high difference! - the difference between the calculated and the original VE value is too high
| There was no incoming value in this cell | |
| The count of incoming values is between 1 and Min.data | |
| The count of incoming values is greater or equal to Min.data. The VE table will be altered (if AutoTune is enabled), but it may change. Wait until it becomes green | |
| The cell is tuned. There was no (or just a minimal) difference between the currently and the previously calculated VE value. (see Tuning precision) | |
| There are enough data in the cell but the difference between the calculated and the original VE value is too high (see Maximum allowed change) The cell of the VE table remains unchanged |
Tuning Ahead feature
Tuning ahead means that the value of a cell can be calculated by doing extrapolation. See image:
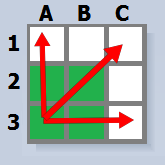
This extrapolation can be done in 3 directions:
- horizontally - right
- vertically - up
- diagonally - right & up - currently diagonally tune-ahead is not supported
- Tune ahead to RIGHT: if cells A3 and B3 are tuned already, then the value of the cell C3 can be calculated from A3 and B3
- Tune ahead to UP: if cells A3 and A2 are tuned already, then the value of the cell A1 can be calculated from A2 and A3
- Tune ahead to RIGHT&UP: if cells A3 and B2 are tuned already, then the values of the cell C1 can be calculated from A3 and B2
Note 1: only these directions are supported (eg. you can not extrapolate in lower direction - calculate A3 from A1 and A2)
Note 2: extrapolation will be done only if the target cell does not have any data (it is "empty")
After tuning
If you are satisfied with the result, do not forget to burn your config to the ECU :)
Statistics
Click on the ![]() Statistics tab
Statistics tab
You can see some statistical data of the analysis:
- the total number of incoming data
- the number of outlier values
- the number of outfiltered values
- how many cells have been altered
- the average and maximum cell change