|
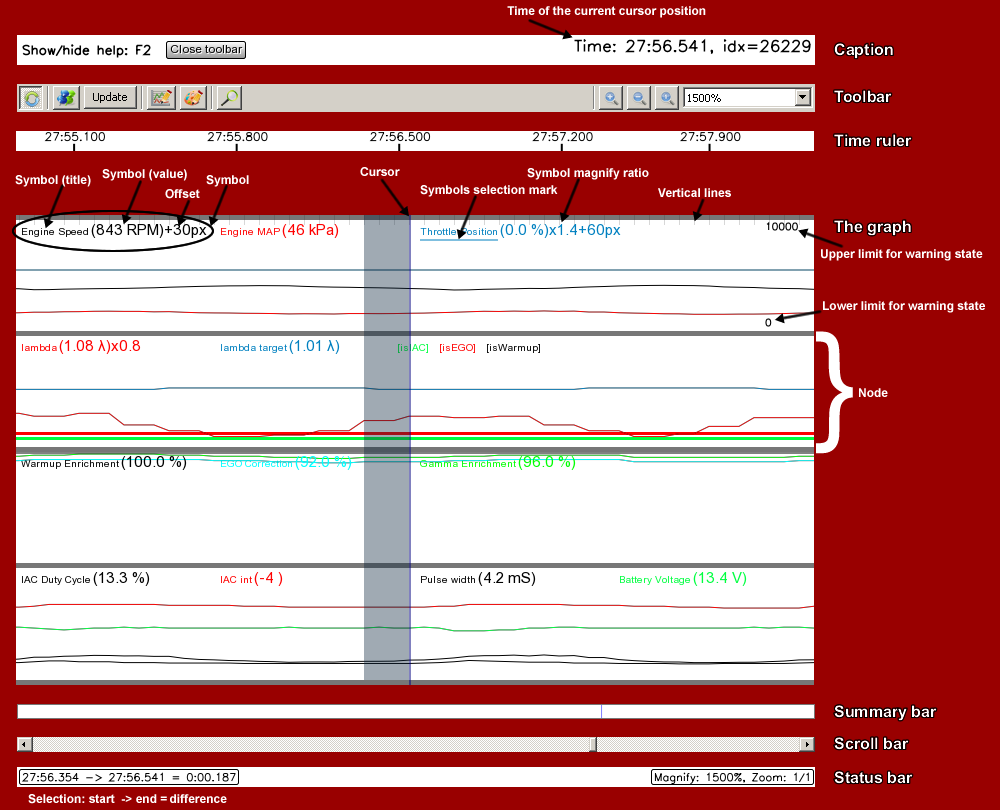
- Toolbar
Contains:
 | Switch on/off gauge refresh. If click somewhere in the multigraph, the selected position will be refreshed on the gauges, if this setting is on. |
 | Open markers settings dialog. Show/hide the markers on the graph. |
 | Update graph log history. details... |
 | Open descriptor editor for current profile. details... |
 | Open theme editor for current profile. details... |
 | Open search dialog. details... |
 | Zoom in |
 | Zoom out |
 | Zoom to 100% |
 | Select zoom from 2000% (max) to fitted ratio(1/n) |
- Time ruler
Shows the graph time with milliseconds.
- The graph
- Summary bar
Shows the whole log memory.
Contains:
- Symbol expression based search result.
- Actual selection
- Current cursor position
- Markers
- Status bar
Contains:
- Info about the selection (start -> end = different, if the selection exists)
- Zooming info
Good to know...
- If the opened file doesn't have enough data, the MultiGraph will not draws a graph.
Update overwiev
If connected an ECU, the log memory of the VemsTune is beeing empty and the MultiGraph will not draws a graph.
The multigraph has no "realtime" mode at the moment, so altough the log memory of the VemsTune is growing, the graph will not refreshing automatically.
If you want to watch the new data press the "Update" button on the MultiGraph toolbar. This is refreshing the scrollbar of the MultiGraph, and you will be able to scroll to.
|


