Wishlist
This page should generally contain only wishes and observations about functionality, not bug reports. Use IssueReports/VemsTune for bug reports.
Multicast=enabled; Multiple VemsTune -s (possibly on several continents) simultaneously receiving runtime data from the same VEMS ECU
Displaying gauges, logviewer, datalog; note: currently only the master can change ECU config/table values.
Useful eg. for "tuning party", where friends or experts can follow a tuning session and propose changes / experiments.
TODO: write recommendations, examples how to use when master VT is behind NAT, eg. mobile broadband
"Multicast" function has been available since VemsTune 2014-09-09
- The master (or server, if you like) VemsTune has Preferences / Internet / Multicast=enabled (restart needed when enabling this, or when changing listen/connect mode or address)
- master VemsTune connects to ECU normally via serial port (alternatively over TCP/IP OverTCPWireless either wifi or ser2net or other method)
- listen mode: acting as a server, multiple slave VT-s can connect (and reconnect arbitrary many times)
- or connect mode: not recommended; normally 1 slave VT can connect (theoretically more slaves can be hooked up using a forking relay; when tested by Marcell, with naive implementation: slave VT-s were flooded with unexpectedly high rate of runtime data and lagged with dozens of seconds; other methods are better). In connect mode VT does not attempt "reconnect" if the TCP connection is lost. Another reason why "listen" mode is better.
The slave VemsTune-s can be older than 2014-09-09 (but latest VT recommended anyway)
- Preferences / Communication: TCP/IP (not via serial port).
- multicast is NOT normally enabled on the slave VT-s (although it is theoretically possible to "re-share", creating a tree topology, this network topology does not improve reliability and should not be needed for even 10-20 simultaneous connections even on low-bandwidth mobile connections ).
Unfortunately, most internet connections are crippled:
- no fix IP address (dynamic IP)
- This can be solved rather easily (dyndns, noip.org, iplocation.net , own service)
- UPNP not supported, and no easy way to configure DNAT port forwarding
- or no way at all: often the case with public internet, or mobile hotspots
- EXPERTS ONLY: http://samy.pl/pwnat/ pwnat allows direct connection from slave VT to master VT (even if both are behind NAT); The slaves can connect if they know the IP address of the master VT (like with a webserver); but the server does NOT have to know the client IP address (this is obvious for a real server but very tricky when server and client are both behind NAT).
- depending on the NAT box, it cannot always connect (without third party to tell the peer's IP) if both client and server are behind NAT - it's very tricky situation and the ICMP / UDP workaround tricks don't work if the firewall is very restrictive
- EXPERTS ONLY: http://samy.pl/chownat/
- worked well, but to make connection, both sides have to know the (real) IP of the other. It's inconvenient that client IP-s must be specified in the server (master VT's host)
- perhaps a combination of chownat or pwnat and some "rendezvous" point (or advertisement; to follow server-IP changes, and restrict access if needed) would be best.
- For now, Tor.eff.org should not be essential in the setup.
Auto Tune. Inspiration for developers http://www.youtube.com/watch?v=qwkqjotkDJQ&feature=related
General wishes
- Opening multiple log files as one as customers have a habit of logging in multiple files so adjusting one map based on all logs is quite difficult.
- Get VT more stable. Dig out one by one the causes for the crashes and broken links.
- Handling of files coming as a starting parameter from explorer. For example double clicking on a .vemslog file in Windows explorer can end up with starting vemstune (with the right association set, best would be vemstune-installation time) which is fine, but then vemstune should handle the file just like it does when the file is drag&dropped over it.
- Analog input calibration is graphical as well. i.e 2d curve is automatically drawn for the relevant sensor being updated. User can then test the response by inputing test values to see engineering values
- Vemslog to csv : actually creates a csv file, not a tab limited file.
- Probably TAB delimited csv should be forgotten forever: it's very fragile and found to break on different language version of windows, office, etc... ';' delimiter seems to be more robust
- New empty groups/sheets/tabs can be easily made
- Groups (worksheets) can be saved like files and opened like files by exporting / importing into workbooks (not like current implementation of exporting all the gauges on a sheet, then having to make an empty one and import gauges again)
- All Groups (and all gauges within those groups) / channel descriptions / custom math channels are saved as a file, allow option of selecting which such workbook to use on startup.
- add mouse oriented option for exiting from Fullscreen mode
- Ignition Analyzer like VE-analyzer couple of WOT runs on stretched road over rpm range
- step0: Run 1 record ignition angle and A/F
- step1: Run 2 retard ignition 2 degrees and run again
- step3: compare A/F in run 1 and 2
- step4: if step1 A/F > step0(retard 2 degrees) else advance 4 degrees. ect. ect.
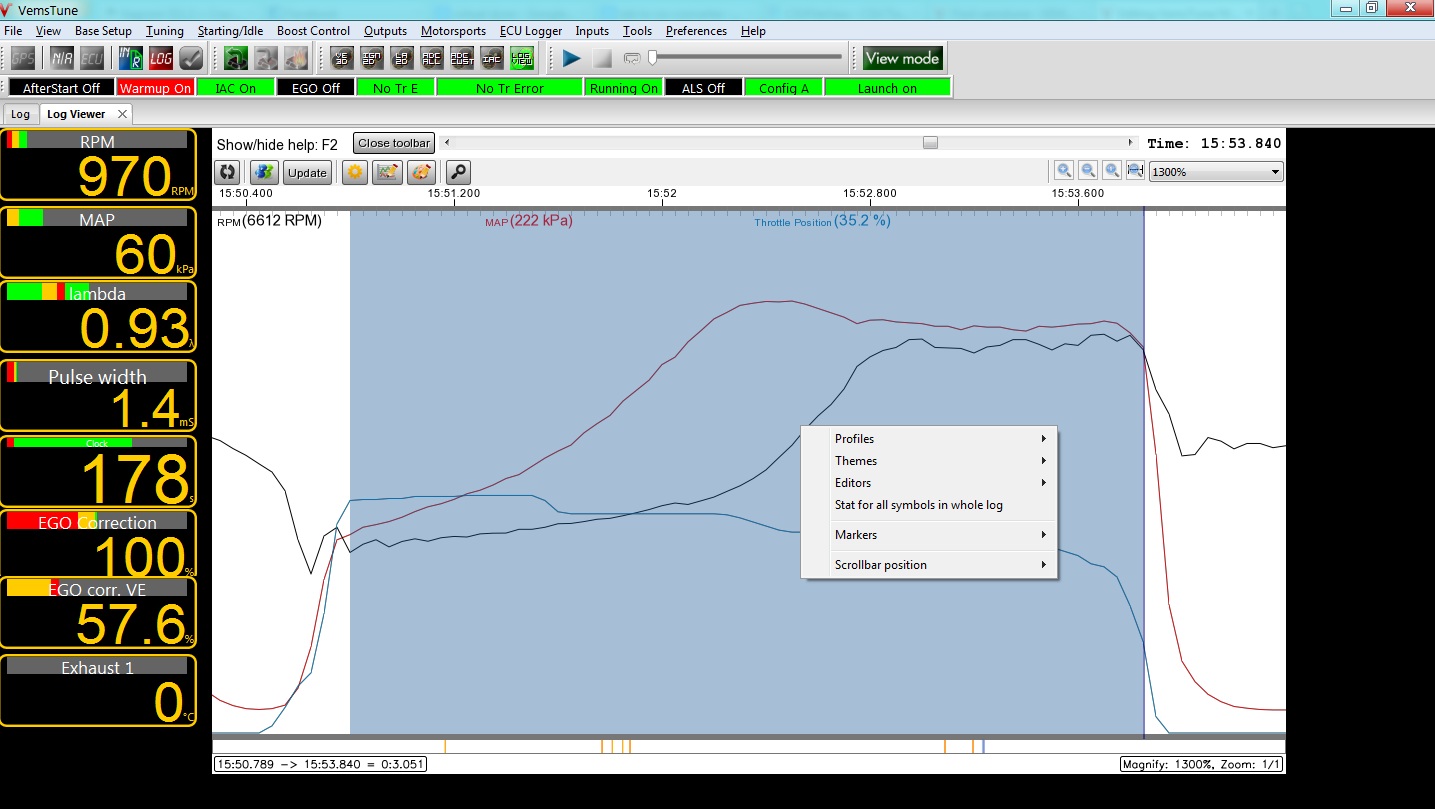
- in multigraph, Select A=>B, press enter => should bring up (zoom into) the selected range A=>B
- ESC should "zoom --" (Zoom out completely). These functions together allow to quickly inspect the interesting parts of a log.
- "Jump to next boost" quick-key would be awesome. (it would jump to the start of next MAP > 110+ kPa part, and autozoom so the relevant section is shown: screensize min 10 sec, max 60 sec).
- Drag&drop(like VE,spark,lambda..) for tables for boost control(boost target and ref DC table), also for knock table
- Table remap should allow changing min/max bin values, currently you have to edit these before a remap if you want lower min or higher max value.
- TPS Calibration wizard, a few easy steps to calibrate the throttle position sensor.
- The wizard figures out the sensor polarity and enters the numbers for the user.
- will be available in the next release
- Store folder locations in memory to remember which folder the user last saved/opened files to/from. Location is reset when ECU comes online to point to the ECU working directory.
- Fix in next release
- User marker while datalogging should give visual feedback (status line text and colour field blinks for 1 second).
- will be available in the next release
- 3D table editing
- Add option to have coloured polygons instead of wire grid, to get a 3D surface look. Custom and default yellow-green-red palette. It is useful while tuning to more quickly grasp the shape and values of the table. Intersecting points can be highlighted to reflect changes not sent/burnt to ECU.
- VE tune by statistics
- needs more documentation, re-worked and integrated better into the software
- http://www.vemssupport.com/forum/index.php/topic,1186.0.html
- Boost control
- needs documentation
- clearly defined features with examples
- Triggerlog
- 0-720 degree event diagram based on ignition and injection settings
- helps set up ignition order and timed injection
- Add option to lock settings windows button row buttons (Refresh Send Burn Import < > Close) for every window. Moving the mouse cursor is more time consuming on a laptop; if the cursor can be left in one position while user tabs through text boxes for settings then can click ">" without moving mouse, it should make for easier menu navigation.
- < and > buttons should be disabled when at the first and last menu, respectively. Current behavior is not bad but user may wait for next menu when it does not exist.
- Fix in next release
- Add option to set theme style on all gauges or a selection of several gauges at once.
- In next release switch to Edit mode, and right click on the background.
- Add ability to save notes to configs, ie as an English description of changes since last config.
- Varying behavior for disabling settings in various dialog boxes. Some text/dropdown boxes are not disabled, etc.
- Web Proxy server support for "Firmware Web tool" and possibly elsewhere also
- we are working on it
Found this program Virtual dyno and hope we could have the same function in Vt so we can see when we are making more power Hp/Nm

http://www.bradbarnhill.com/projects/VirtualDyno/
make a 2000-6000 pull and 100% tps
Convert to .csv
open csv file in excel
delete the first line “vems” to make it work
Nice functions to have in Vt:
Peek Nm and Hp
3 runs graph in the same row
Measurement on the fly
Was implemented as a log-analysys expert tool: LogAnalysis/PowerCompare . A more user-friendly, and possibly realtime tool would be nice though.
Addition to this idea -
Re-iterated in hopes of implementation into Vemstune or as an example :
Vemstune can export real .csv files not tab delimited files named .csv like now and they can be opened via Virtual Dyno.
The first line of the log where it says "vems" could be skipped.
The .csv file can be made from viewing a section of log in the Log View and right click - save as .csv file
Then it can be opened by Virtual dyno without any editing.

Wish for the Round
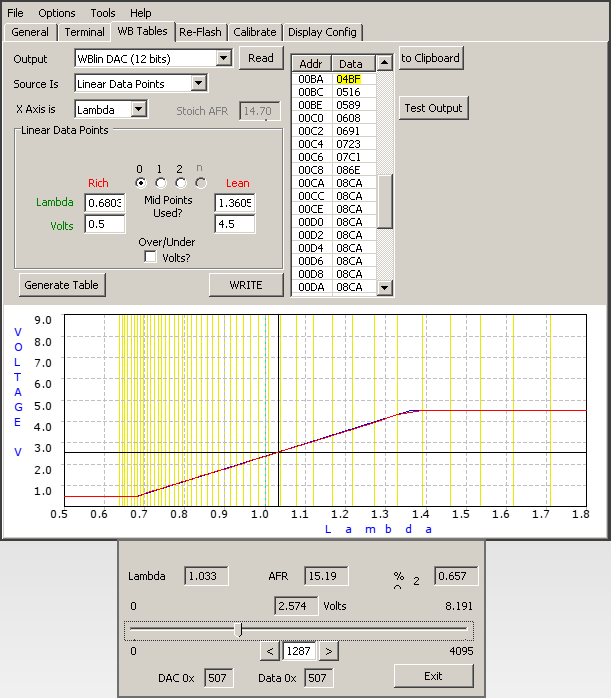
A wizard to create the wideband custom curve would be very useful, just a simple two point linear curve generator would suffice in most cases that allows you to simply set min/max lambda and corresponding min/max output voltage. It's also useful to have a test-mode where you can force the output while checking for the same result in the ECU that receives the signal. The test mode is useful for all output types, not just the custom curve. I got within 0.01 AFR acurracy from 10:1 to 20:1 AFR with an Autronic unit, if not for the test mode I would have been 0.4 AFR off at either end of the signal.
Download WButil for TechEdge WBO2 and play with it: [Unzip and run]
Here is how it's curve wizard appears with the test mode,
The blue line is the wideband units signal and the red line is generated from the wizard. The crosshair is at the test output voltage.

Log viewer
22/12/2015
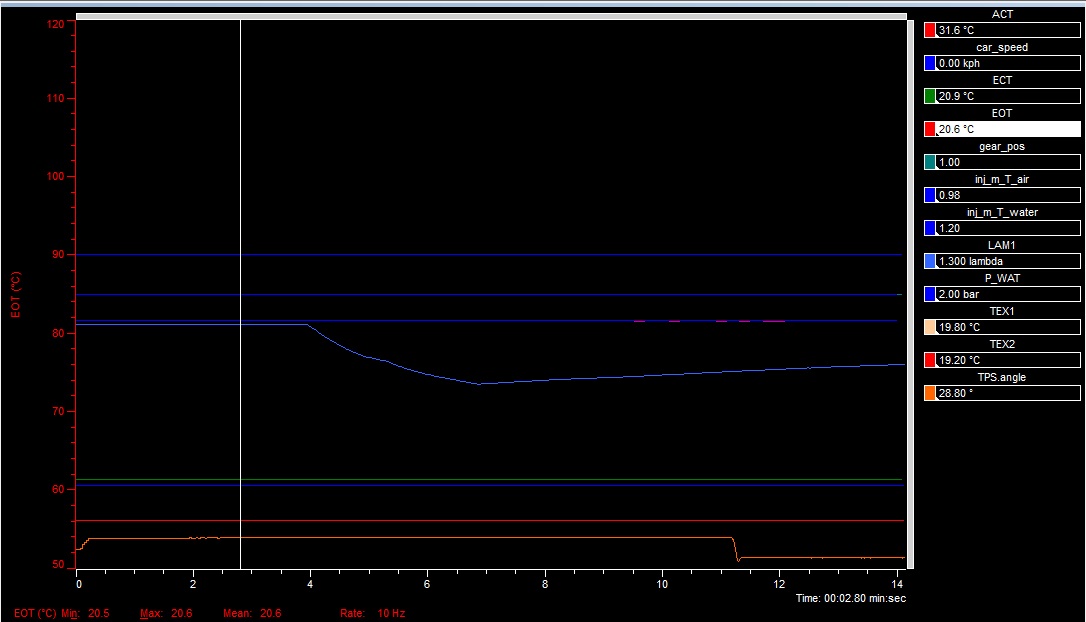
Request for data channels to be shown on the right hand side like so

Selecting channels in log viewer should not need a descriptor before being selected into log viewer, when a channel is selected and no descriptor is available Vemstune forces the user to make one or makes one based on max and min values found in the data.
Allow flags to be channels with their respective values but the right hand side shows the text definition from VemsFlagDescEditor
Save selected area should be called "selection export"
Any chances on implementing additional math functions? like filtering, integration over time, differentiation against time, previous value comparison and registry creating? Even if it´s only possible in Log viewer and not real time, more important that way anyway, especially with heavy math.
like
integral(channel_name) , and say you have roadspeed as the channel you get distance as the product, or if you have acceleration you get velocity and so on,
or
differentiate ( GPSspeed ) , gives you acceleration and so on .
- X/Y Scatter plot based on any channel for either X or Y axis with configurable axis and automated scaling
- Histogram plot of any channel
- Multiple log files opened at the same time
- channel time offset, allows moving Lambda value channel about to fit actual operation of engine.
- Allow more then 4 channels at a time in the same graph portion
- Improve speed
- Zoom in/out and scrolling in graph is slow compared to other systems
- Multiple key presses for zooming in/out should not trigger another redraw while one is progressing
- Search in log with expression speed up, slow even on short logs
- we are thinking on it, try to find out something
- "Time Re-set Mode" - allow time line to be set at "0.0 sec" at cursor to start time at "0.000 sec on Drag Launch (use "T" Key)
- we are working on it
- Quick method of finding of maximal or minimal values (right click on symbol in graph)
- will be available in the next release
- "Compare to" mode through overlay of a log over another
- quick on/off key for the overlay ("Insert" key to add/remove 2nd log)
- easily shift the 2nd log in time to align to events occuring in both logs
- "Cursor stay in center" mode (use "C" Key)
- Auto-adjusting min/max values of graph in symbol menu
- Calculate average value of symbol in selected area
- will be available in the next release
- Show min/max values (next to symbol title?)
- will be available in the next release
- this is nice, but makes log opening really slow on older machines. Calcs should be done in background process and allow working on the opened log meanwhile.
- will be available in the next release
- Zoom using up/down, not only pgup/pgdn
- you can set any key for any exists function in Preferences / Hotkey config / MultiValue graph
Separate topic on support forums : [link]
Documentation
- Every variable should have an explanation in the help dialog.
- Variables that no longer exist should have descriptions removed from help dialog.
- help dialog descriptions in same order as main dialog box variables.
There are a number of variables where it is not clear what they control by the descriptor in the main dialog box.
Postponed ideas
- remove backwards running injection, trigger tooth and ignition order in output tables.
- going from top to bottom would cause a big confusion and render lots of text invalid (some uneditable like in forum posts). We do not want to confuse our installers simply by changing that
- short-run: add arrow to show direction (already implemented).
- Going in a circle (it should be clockwise, I guess): this would not cause confusion. Arrow is still good.
- Even more useful: marking which cylinder it relates to!
- Video problems make lines hard to see
- Move channel values to right side of screen (out of the way) like in MLV.
- some use for led 2, misc out like power on led or problems indicator.
- It is on one of the P259 channels - if you want to use it, then select it for the warning light or other function. See GenBoard/Manual/DigitalOut/Table
- Yes but i think its nice to turn it on when the board is power on aside the blinking telling the processor is running.
- It is on one of the P259 channels - if you want to use it, then select it for the warning light or other function. See GenBoard/Manual/DigitalOut/Table