November 2012
Python program
The install of the ignition is now completed. The ignition map is still the oem Microplex Marelli ecu.
Before 'fine' tuning the map, I asked myself about the data sent by genboard.
VT is a nice tool but for analysis,it may be better to have his own , so I made a Python program
http://www.vems.hu/files/maserati/vemslogpy.zip
which function plotvlog runs the .csv log file as converted by VT. The arguments are the name of the .csv file and a list of variable names to plot. With ['RPM','MAP',Spark','TP'] one gets
For some reasons variable names from the header of the .csv file are not always the VT ones: TP here is the Throttle Position.
Of course the plot got under Python is interactive plot and allows to zoom etc ...
Noisy RPM data
- Noise when idling
The Canvas dataframe returned by plotvlog can be analysed interactively with Pylab.
Under Ipython with
>plot(dat.index,dat['RPM'])
>plot(dat.index,dat['RPM'],'x')
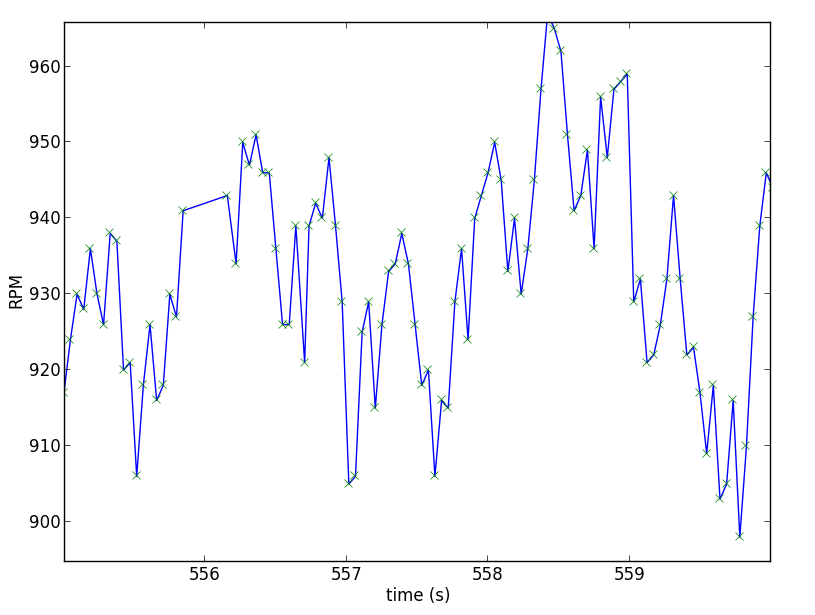
I got a RPM/time plot where I zoomed a 5 s period of idling:

the green crosses 'x' are the RPM values sent by Genboard each 44 ms (or so, this is not the loop period of the internal genboard processing)
On this graph, one sees a large oscillation of the speed due to the idling valve around 925rpm and some big jumps, sometimes as large as 20rpm, at 2 successive 'x' (40ms)
At this mean speed 40ms is about 220°. As the fire events for this odd engine are 90°,150°,90°,150°, 2 fires can occur during 40ms and this may explain the large increase or decrease of the speed.
However the question is
- Are these jumps equally due to any noise added by genboard/VT?
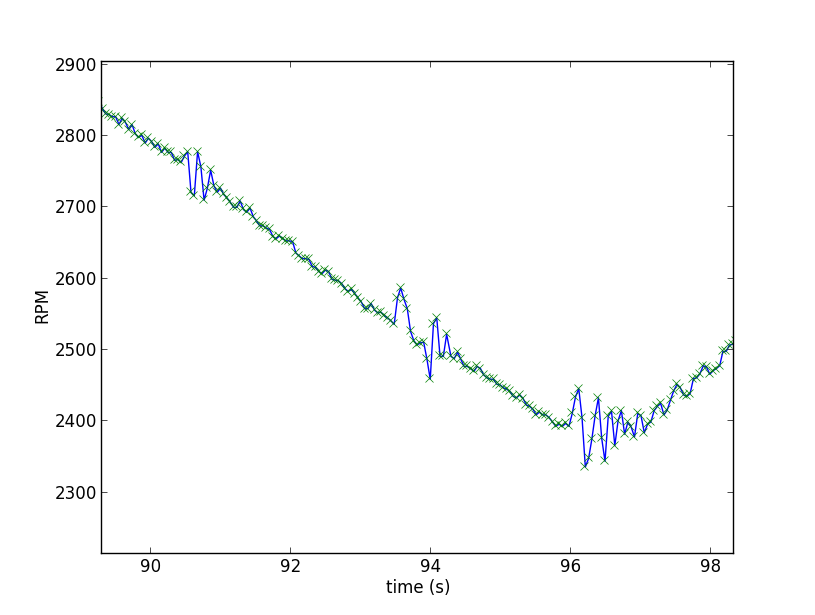
- Noise when running
Some strange transients here occur suddenly from time to time
 .
.
It looks like the response of a 2nd order filter to some impulsive input.
I have never noticed any misfire when driving, besides they would not make the speed accelerate at the begining. Moreover the pic to pic may be as large as 100rpm.
Nothing on the MAP graph
I do not have any explanation yet.